The ‘uncles and nephews’ of the Lichtensteins.
In 1980, 3000-year-old skeletons of forty individuals were found in the Lichtenstein Cave near Osterode in the Harz Mountains. In the dissertation “Molekulargenetische Verwandtschaftsanalysen am prähistorischen Skelettkollektiv der Lichtensteinhöhle” (‘Molecular genetic kinship analyses on the prehistoric skeletal collective of the Lichtenstein Cave’) by Felix Schilz in 2006, the Y-DNA was analysed using Y-STR. Twenty-one of them were males and thirteen of them belonged to the Y-haplogroup I-L38. This led to the carriers of I-L38 being nicknamed ‘Lichtensteiner’. Until 2015, these were the only known aDNA samples (old DNA) of I-L38. Since then, due to a large number of studies, several dozen samples have been added, the ‘uncles and nephews’ of the Lichtensteins, so to speak. By the way – ‘uncle’ Cheddar man, Britain’s oldest almost complete 10,000-year-old skeleton, is also the ‘uncle’ of the Lichtensteins, as well as all other I-L38 cousins.
With the title ‘Reconstructing the Journey of Y-DNA Haplogroup I2-S2555 to I2-L38’, Hans de Beule, an administrator of the I-L38 project, has succeeded in producing a comprehensive summary of the studies published to date. It contains detailed information on all aDNA samples of the Y-haplogroup I-S2599. An absolute must-read.
In contrast to the comprehensive study by Hans, this article is purely technical and deals with an exact or alternative classification of the samples in our I-S2599 Y-haplogroup tree and the visualisation. For this purpose, I downloaded the raw data of all known samples, processed, analysed and sorted them into a common table. All aDNA samples were visualised on a map together with the subjects of commercial tests.
The first part of this article is specifically about the aDNA samples from I-S2599. In the second part, I explain how and with what I did the analyses. The second part may therefore also be of interest to people who have nothing to do with I-S2599.
The Y-haplotrees and aDNA
ISOGG
Most studies still use an old and actually outdated designation for Y haplogroups, in the case of I-L38 this is I2a1b2. This was last used in the ISOGG haplogroup tree, whereby the latest version from 2019 is usually used and sometimes even an older version from 2016, which can lead to confusion. In the article I-M170 and the Babylonian confusion of Y-Haplogroup names, I showed how problematic it is to use this spelling. In addition, the tree has not been updated since 2019, so the branches and splits discovered in the meantime are not taken into account. Yleaf, a programme for determining Y-haplogroups that is used in many studies, referred to this tree up to version 2.3. From version 3.0 onwards, Yleaf switched to the tree from YFull.com, so that the specification of the haplogroup using this tool will look different in future.
YFull
The Y-haplogroup tree from YFull.com is the most flexible and transparent of the Y-haplogroup trees. All NGS (Next Generation Sequencing) tests from different providers can be uploaded, regardless of the human genome reference with which the raw data was saved (hg19, hg38, T2T). Since WGS tests (Whole Genome Sequencing) are also included, this tree contains the SNPs that were found by aligning to the T2T reference. I recommend anyone who has done a WGS test or an NGS test at FamilytreeDNA (BigY700) to upload the raw data, preferably the BAM file with T2T reference, to YFull.
In addition to commercial testing of living humans, aDNA samples are added to the tree in the same way. Since aDNA samples of low quality would negatively affect the function of the Y-tree, only aDNA samples of sufficient quality are uploaded. Unfortunately, this means that only a few aDNA samples, currently only five out of over fifty, end up on the I-S2555 (S2599) YFull tree. Positioning on the tree is based on the most recent accurate positive SNP. If positions on younger sub-branches are also possible (nocalls for younger sub-branches), the alternative possible positions are displayed as additional information.
Group administrators can add the aDNA samples to the group and view their SNP analysis with the known functions of YFull.
FTDNA
The Big Y-700 from FamilyTreeDNA is the most successful NGS test on the market. The results of this test are uploaded to the FTDNA Y-haplogroup tree, making it the tree with the most tests and also the best known. It is not possible to upload tests from other providers. There are several views for the tree. Only Big Y users have the possibility to view their results on the block tree, as it is not public. In addition, there is a public Y-DNA Haplotree that is accessible to everyone.
Since summer 2022, the Discover pages have been available with additional trees on which aDNA samples are also displayed. I prefer the Time Tree. Almost all aDNA samples are displayed here. The positioning on the tree is based on the most recent accurate positive SNP. No additional information (nocalls for younger sub-branches) is provided, so it is not possible to determine whether positioning in a younger sub-branch would be possible.
Project administrators have no possibility to view further data from the SNP analysis.
Further Y-trees
In addition to the mayor Y-haplogroup trees, there are two more that I would like to mention shortly here.
- The Y-tree from the Chinese provider dnachron has only a few kits. These are mainly kits from studies with living people whose WGS has been analysed.
- The Y-tree from the Chinese provider theytree has hardly any commercial kits. Instead, there are some kits from studies with living people whose WGS has been analysed and a few aDNA samples. Unfortunately, the work here is not so accurate and the aDNA samples often end up in the wrong position. Nevertheless, I occasionally visit this site to see if new aDNA samples are available so that I can take a closer look at them myself.
Grouping of aDNA
My main reason for doing a Y-DNA test was originally to verify a family legend. I realised that my Y-haplogroup I-L38 originated somewhere in northern Europe about 4700 years ago. As a ‘child of migration’, my parents are from Greece and I was born in Germany, I am also interested in this ancient migration and am trying to find out which path my ancestors (in the male line) took.
Commercial Y-DNA tests and various Y-trees can be used to understand some things, but they depend on the voluntary self-reporting of the testers. Incorrect information included. It is similarly difficult with ancient DNA. The ‘tested’ person will no longer be able to self-report and so we are dependent on the accuracy of the information provided in the studies. In most studies, the exact Y-grouping of the samples is rarely a high priority and fortunately there are YFull.com and FTDNA, which are dedicated to this point and analyse it more precisely. Ancient DNA samples are usually degraded and lack sufficient coverage, often resulting in inaccurate haplogroup assignments. If the coverage is very low, the usefulness of these samples is questionable. What to do with these samples?
- Do not include and ignore these aDNA samples, as with YFull.
- Specify a less specific haplogroup assignment, as with FamilyTreeDNA.
- Choose an alternative grouping that takes into account the place and time in which the deceased lived. I will try this below.
Alternative grouping with the use of time and place.
I think it’s a particular shame not to include the aDNA samples. I prefer to include the aDNA samples anyway and indicate a less specific haplogroup assignment, but this can cause confusion if you take the indicated positioning too seriously and have no further information about the subclades in which an alternative positioning is possible. This creates unnecessary room for misinterpretation regarding the place of origin of a Y-haplogroup and the migration paths. Perhaps it would be better to leave it out? For this reason, I took a close look at all the aDNA samples myself and analysed them. I paid particular attention to untested subgroups that could also be considered for positioning due to no calls and individual SNPs that could not be analysed due to several missing values. Please note that I am not a specialist and only approached this topic as a layman.
The following image shows an overview of the assignment of the aDNA samples to the individual SNP blocks, i.e. subclades.
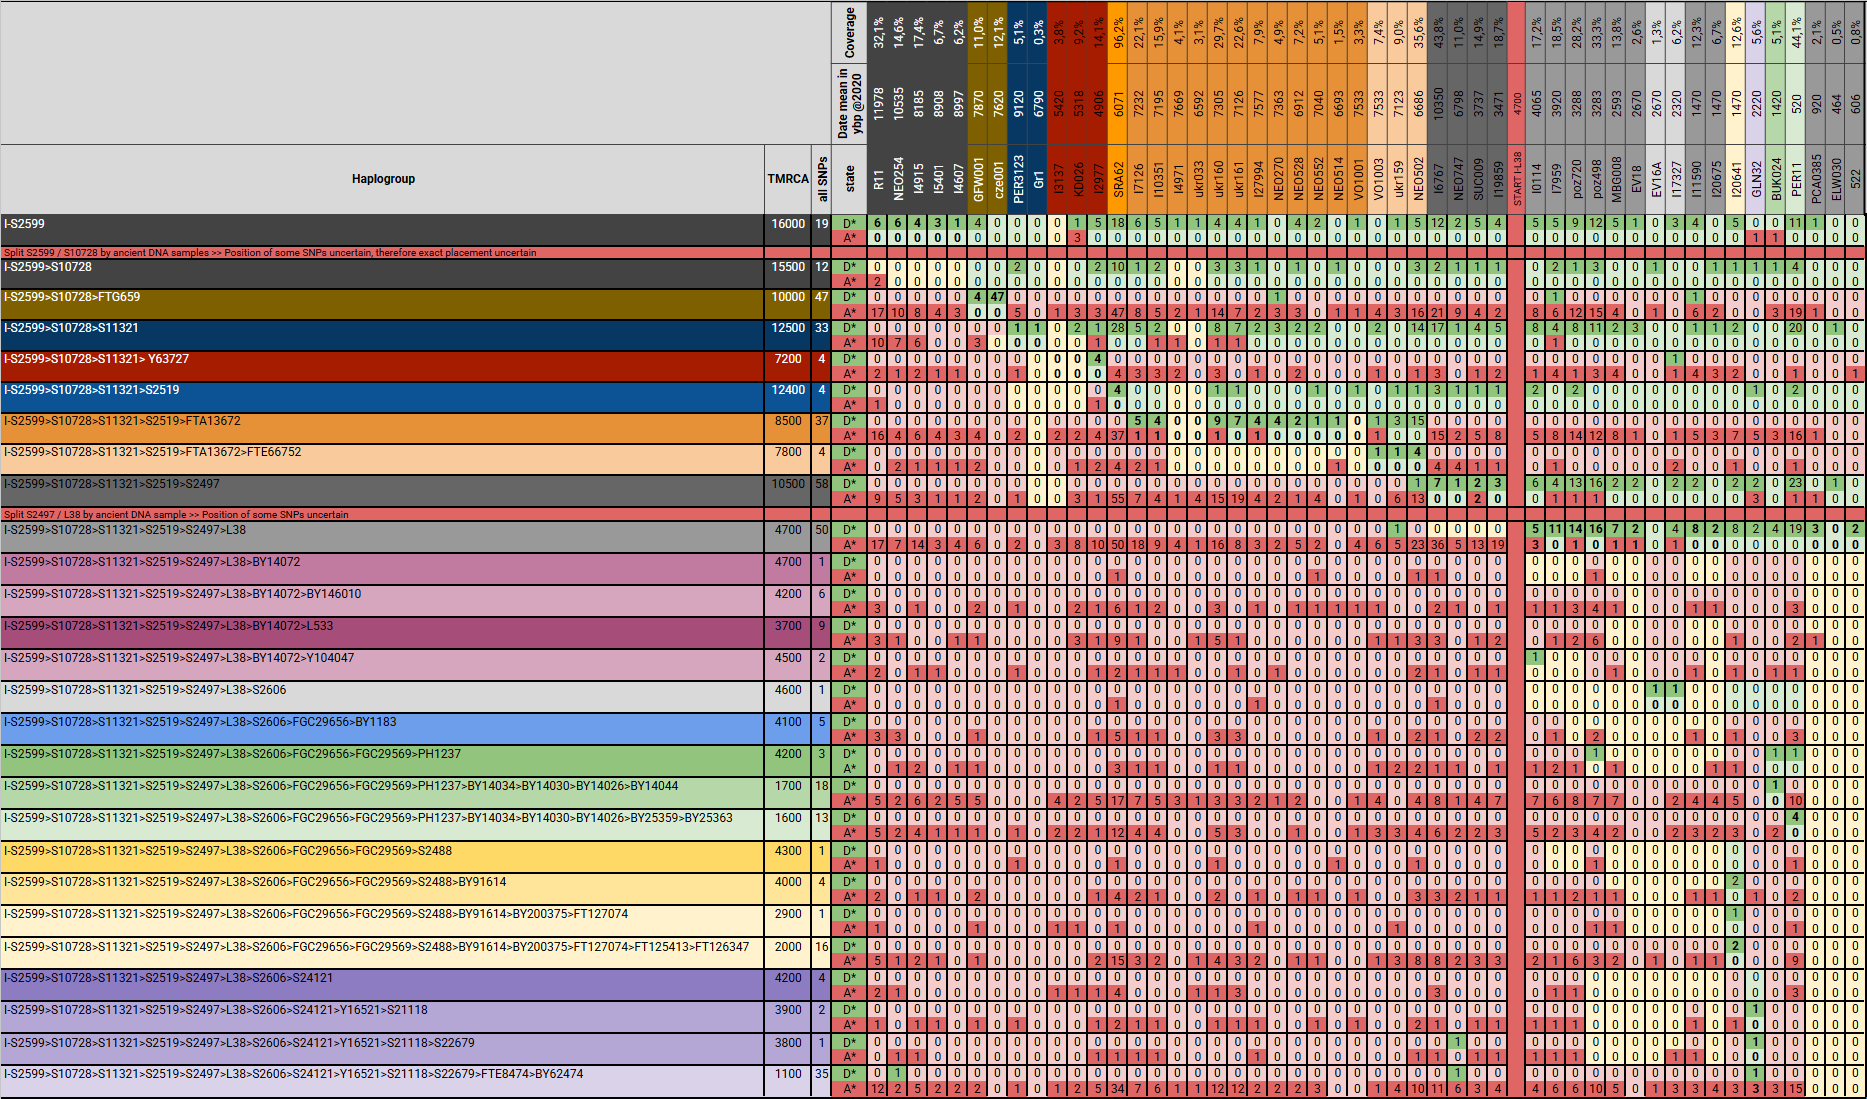
Positive SNP blocks are green, negatives are red, the position of the preferred grouping is printed in bold and the alternative possible positions are yellow. The TMRCA (Time to Most Recent Common Ancestor) and the determined age of the samples were also taken into account. It is easy to recognise that in some cases there are false positive and false negative SNPs. In most cases these can be recognised and taken into account, but in some cases it is not possible to accurately place the sample. The complete table I-S2599 – aDNA – SNPs with the master table, which contains all values of the individual SNPs, can be downloaded in the attachments.
I-S2599
Alongside I-M223, I-S2599 is part of I-M436 (I-P214) and can be regarded as the ‘main group’, to which I-L38 belongs as the largest group. FTDNA (image below) has placed 9 samples here. This is the ‘catch pool’, so to speak, for samples that cannot be further specified. I took a closer look at the four younger samples and placed them further down the tree (the coverage of these samples is very poor and they could have been deleted just as easily). The remaining samples were found in Italy, on the Danube at the Iron Gate and on the western Baltic Sea. It is interesting to note that some of the samples were found in southern Europe and others in northern or central Europe.

There is no currently available tester who is positive for the I-S2599 block but negative for the I-S10728 block. The split between these two blocks was determined exclusively by these aDNA samples. It is therefore not possible to accurately assign all SNPs in these blocks.
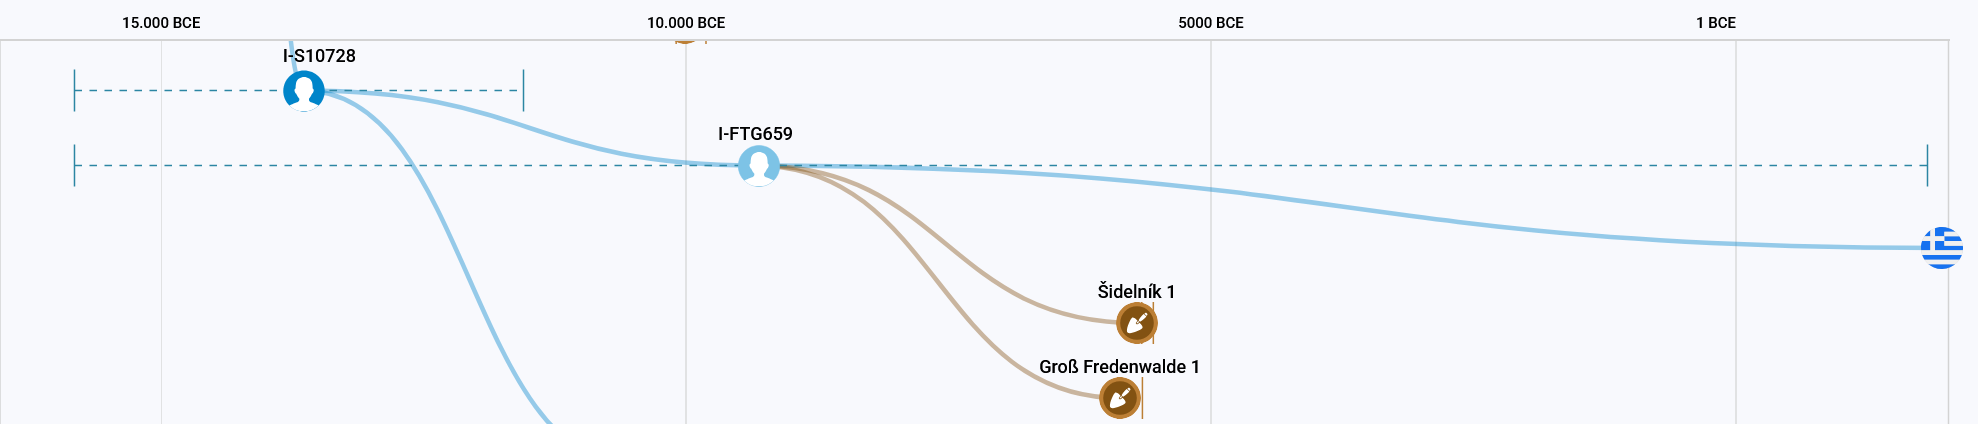
I-S2599>S10728
This is different for block I-FTG659, the second smaller subgroup of I-S10728. Here there is one living tester from southern Europe and two aDNA samples from central Europe. Unfortunately, the aDNA data of cze001 (Šidelník 1) is not yet publicly available, so I have only included the SNPs provided by FTDNA. The tester from Southern Europe does not have a single match and is all alone on this branch together with his son. What is interesting here is that he shares a common ancestor I-FTG659, with two ancient DNA samples from Central Europe, who lived about 10,000 years ago. If anyone is ever sad that they have no or few matches, I always like to show them this case.
I-S2599>S10728>S11321
I-S11321 is a parent group of I-L38, which, in addition to I-S2519, also contains a smaller subgroup I-Y63727. There are two samples that I would like to place here in the main branch, as they cannot be determined further. These are Gr1 (Criewen 1) and PER3123, which is not included in FTDNA. The coverage of these two samples is not good.
FTDNA only shows I2977 (Gen Scot 75) in I-Y63727. This is the only sample that is so good in its coverage that it can be placed here without restriction. Due to the geographical and time-related closeness, I would include the samples KD026 (Strathglebe 26) and I3137 (Raschoille 3137) in this subclade. FTDNA shows Raschoille 3137 in I-S2599, in my case this sample would probably have fallen out completely, as I could hardly find any useful SNPs with the method I used.
Some living testers belong to the subgroup I-Y63482. One cluster of these is in Central Europe and another on the Iberian Peninsula and probably from there to South America and the Caribbean.

The samples VO1003 (Vovnigi 3), VO1001 (Vovnigi 1), ukr033 (Nikol’ske 33) and probably also I4971 (Tiszaszőlős 4971) belong in my opinion to a different subgroup under I-S2519.
I-S2599>S10728>S11321>S2519
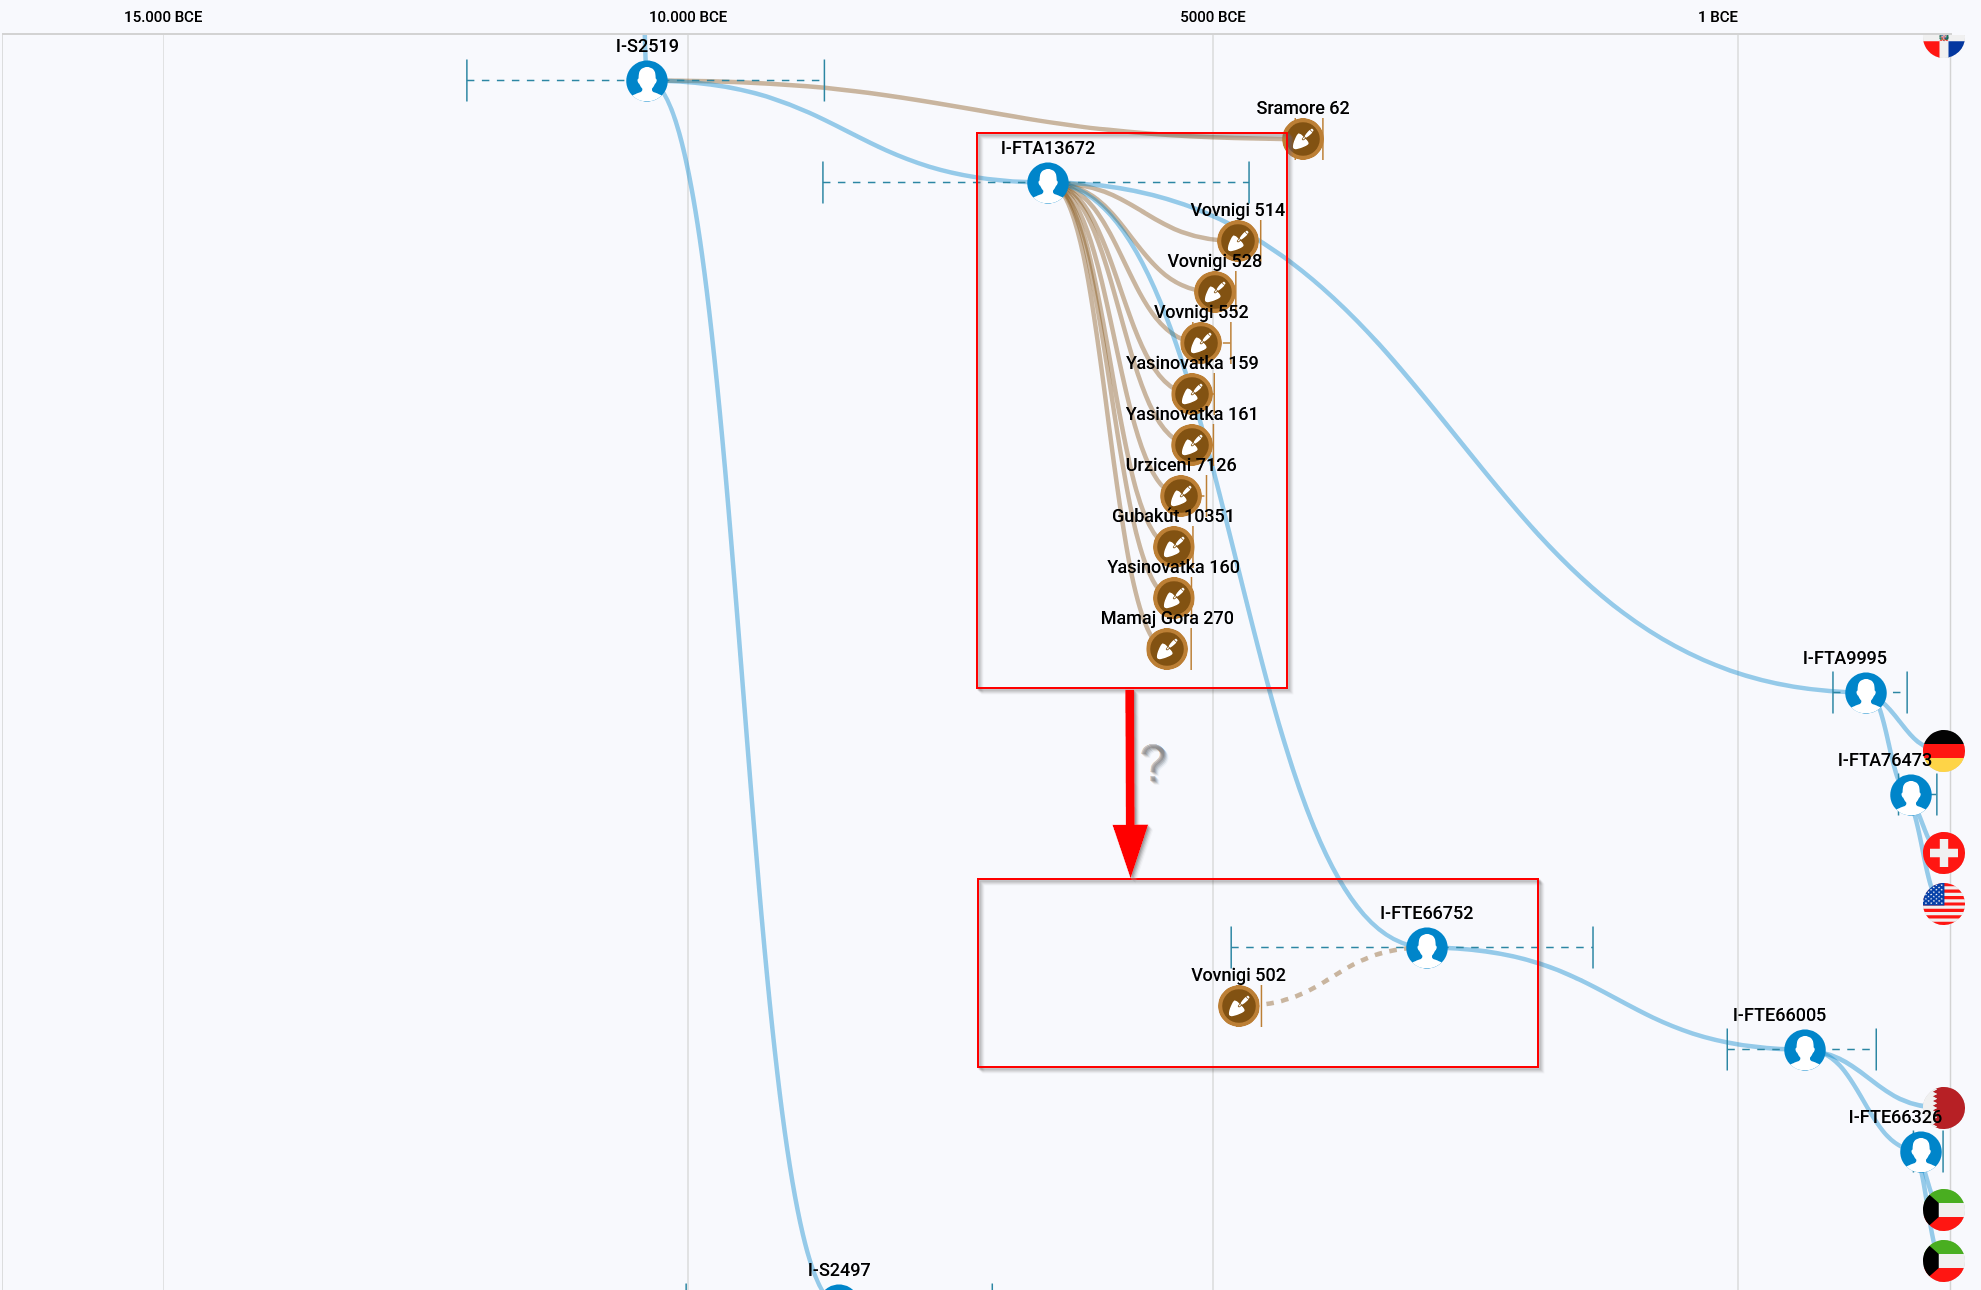
We have a very interesting situation with I-S2519. SRA62 (Sramore 62) was found in Ireland. This sample has very good coverage, so that even ‘novel variants’ are indicated on YFull, which is unique in our Y-haplogroup. This shows that SRA62 does not share any SNPs with the other subgroups of I-S2519, apart from those of the I-S2519 block. There are two further subgroups, the larger I-S2497 with I-L38 and the smaller I-FTA13672.
This small sub-branch originated somewhere between Switzerland and the Carpathian Basin. The two samples from the Carpathian Basin I10351 (Gubakut 10351) and I7126 (Urziceni 7126) belong to I-FTA13672. Here I would add I4971 (Tiszaszőlős 4971), which cannot be placed too clearly due to the poor coverage. A large number of aDNA samples are from the Dnieper, north of the Black Sea, where subgroup I-FTE66752 most likely originated. It cannot be ruled out that several of these samples of I-FTA13672 actually belong to I-FTE66752. Many samples do not have particularly good coverage and in one case there is an interesting observation. I27994 and ukr161 are the same sample and yet there are SNPs that are positive in ukr161 but negative in I27994. This shows once again that single positive or negative SNPs in aDNA samples should not be overestimated.
Another interesting picture emerges with regard to the commercial testers of I-FTE66752. These come from the Arabian Peninsula.
I-S2599>S10728>S11321>S2519>S2497
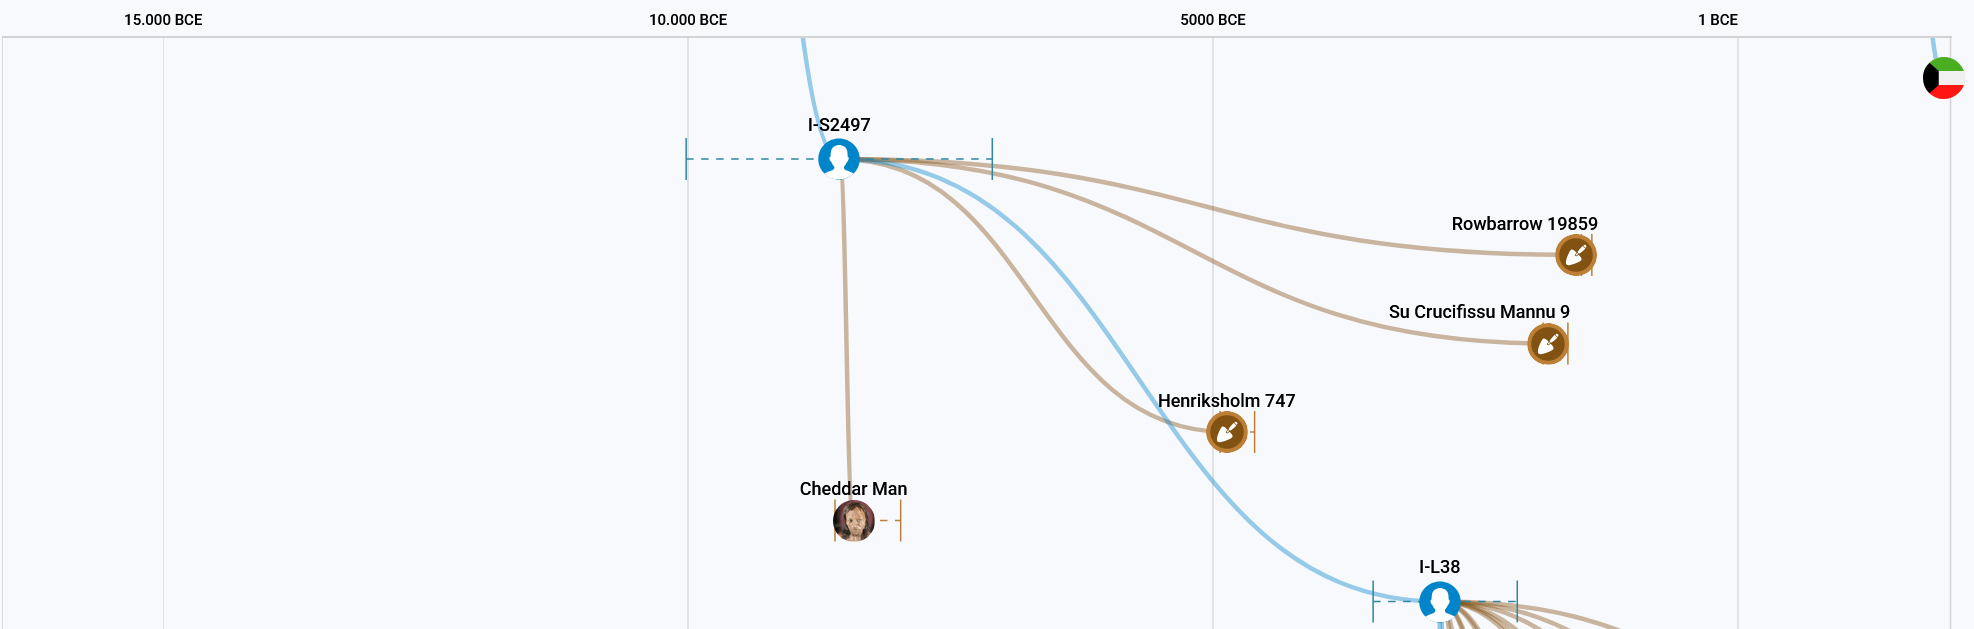
In 1903, the oldest fully preserved human skeleton in Britain was found, that of the approximately 10,000-year-old ‘Cheddar Man’ aka I6767, which is probably the most famous aDNA sample from I-S2599, or more precisely I-S2497. The other three samples belonging to this Y-haplogroup are much younger than Cheddar Man. The location of I19859 (Rowbarrow 19859) is very close to where it was found, and NEO747 (Henriksholm 747) is also not far away. Only SUC009 (Su Crucifissu Mannu 9) was found on an island in the Mediterranean. You could almost think that representatives of I-S2497 wanted to pay a visit to their ‘old home’.
Between I-S2497 and I-L38 it is exactly the same situation as between I-S2599 and I-S10728. There is no currently available tester who is positive for the I-S2497 block but negative for the I-L38 block. The split between these two blocks was determined exclusively by these aDNA samples. It is therefore not possible to accurately assign all SNPs in these blocks.
I-S2599>S10728>S11321>S2519>S2497>L38
The Y-haplogroup I-L38 is about 4700 years old. Within I-L38 there are aDNA finds that lived at the beginning of this period, others only a few centuries ago. It is indeed possible that the older specimens are ‘incomplete’ I-L38, meaning that some SNPs of the I-L38 block are negative, or that they belong to currently unknown subclades of I-L38. The younger they are, the less likely it is that they are ‘incomplete’ or ‘unknown’, but belong to known subgroups of I-L38 that cannot be categorised more precisely due to poor coverage.
I would even go so far as to say that the samples poz720, MBG008 and EV18, which each have a negative SNP in block I-L38, actually belong to known subgroups of I-L38. (In the case of EV18 equal to EV16A) Nevertheless, a more precise placement cannot be made. Three other samples from the late Middle Ages (Ellwangen 30, Austin Friary 522 and Santok 385) have very poor coverage and were therefore only included as I-L38.

Three aDNA samples belonging to I-L38 were found in a cemetery in Heslerton, England. One of them, I20641, can be determined more precisely and belongs to I-S2448. My first approach was to see if the other two samples also belonged to the same subgroup. Interestingly, both samples have negative SNPs for this subgroup. BUK024 (Buckland24) from Dover, at FTDNA under I-L38 I see as part of I-BY14044, a subgroup of I-BY14026.

Sample PER11, which also belongs to I-BY14026, is of particular interest to me. It belongs to my subgroup I-BY25363, is from the late Middle Ages and was analysed in the context of a study in which the remains of the Báthory clan were analysed. YFull goes one step further here and places the aDNA sample even deeper in the tree in (my) sub-branch I-Y128714, which has so far only been found in northern Greece. A single SNP from this block is positive at PER11. This is the SNP A522 (A to G). A to G leads to problems with aDNA samples, so I prioritise the placement of FTDNA here.

Karte
The map was created using Google My Maps and is intuitive. Groups can be shown and hidden to make the whole thing more organised and there is plenty of information for each individual subject.
Conclusion
Deletion, conservative assignment or alternative? The more intensively I dealt with the topic, the more I came to the conclusion that it is not wrong to delete (ignore) aDNA samples with very poor coverage rather than trying to find an alternative assignment. Nevertheless, I made the attempt and documented the results in a table and map. The original reason for an alternative placement was to better model migration pathways, but I don’t want to interpret here.
Analysis of aDNA data – procedure and tools
I am only a layman when it comes to analysing DNA data, so I had to fall back on tools that I know or that I can access quickly. Little by little I figured out how to get the results I wanted and was surprised when I realised that the right programs were already installed on my computer. I used the programme WGSExtract v4 to extract the SNPs from the individual aDNA samples. The SNPs were then filtered using Microsoft Excel with Power Query. These instructions are intended as a guide for people who are not afraid to tackle problems and find solutions themselves. Unfortunately, I cannot offer a point-by-point guide within this context.
- Download and install WGSExtract, incl. reference hg19.
- Find the Study Accession Number for the desired study and the number for the desired aDNA sample.
- Download the BAM and the BAI (index file) of the aDNA samples from the European Nucleotide Archive.
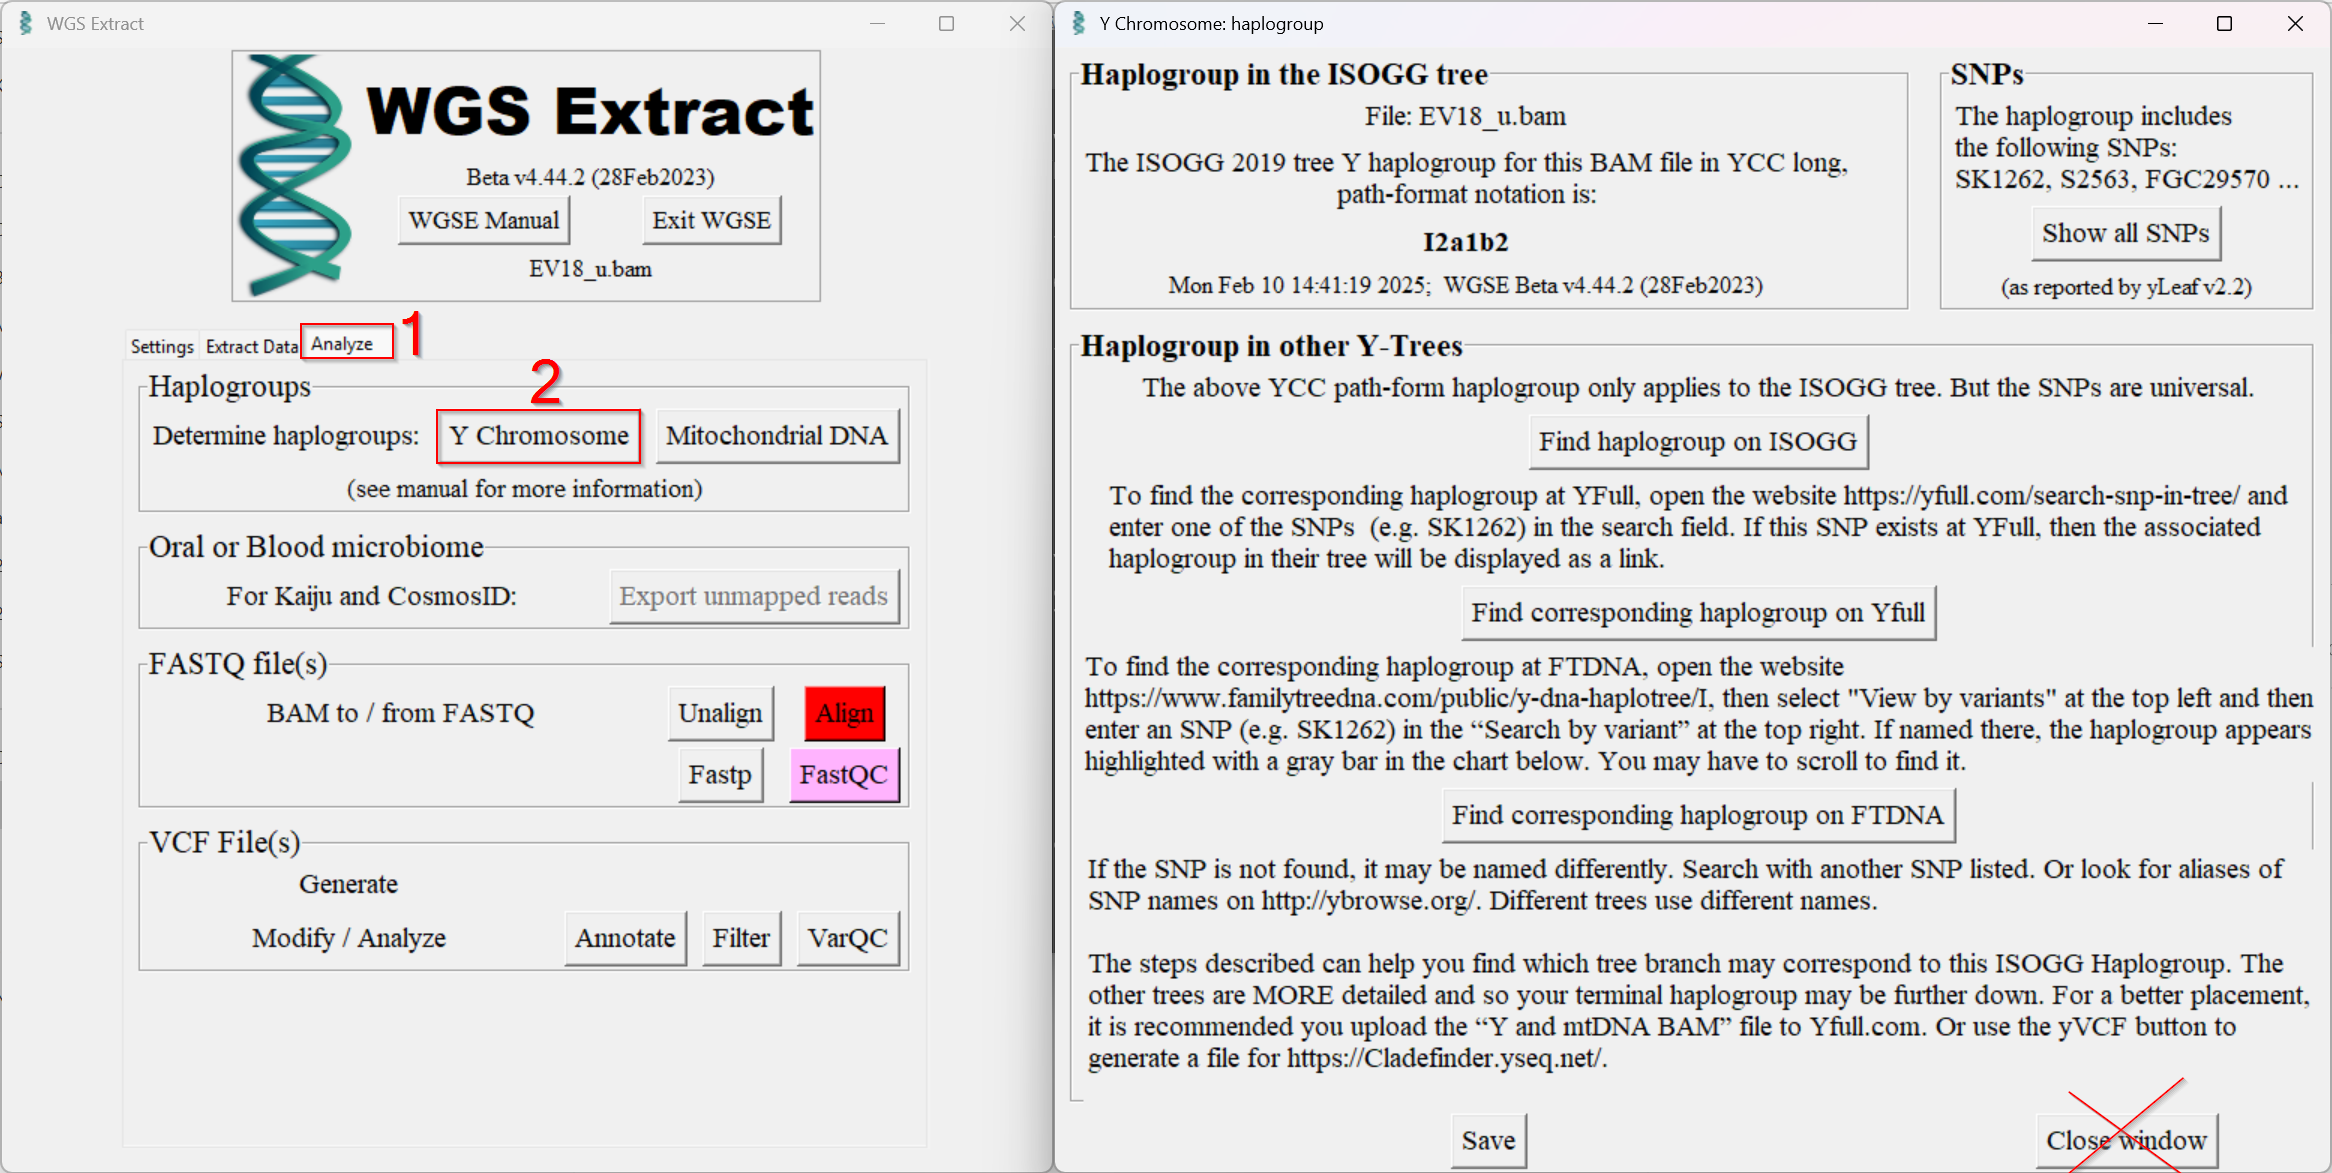
- Start WGSExtract, select working directory and BAM file.
- Change tab and determine the Y-haplogroup of the aDNA sample (picture below 1&2). Do not close the window that opens.
- The Y-haplogroup was determined in the background with the help of Yleaf. In a temporary directory there are two temporary files which we move to another folder so that they are not deleted when the window is closed.
- Add a .csv at the end of the files with the extension .out and .pu by renaming them so that they can be read by Excel and Google Sheets.
The file with the extension .pu is a working file from Yleaf. It contains the information on how often each hg19 position was read and the corresponding results A for Ancestral (negative) and D for Derived (positive). Unfortunately, this file is very large and cannot be opened easily, apart from the fact that you would not be able to find your way around it.
The file with the extension .out is a filtered file. Yleaf filters the .pu file according to a predefined list of SNPs. The WGSExtract version I used uses Yleaf 2.3, where the selection of SNPs to be filtered is taken from the ISOGG tree. Later versions will use Yleaf 3 and filter using the SNPs found on the YFull tree. This will lead to more accurate results, as long as the SNPs are included in the YFull tree. This .out file can be opened and sorted with Excel or Google Spreadsheets by turning it into a .csv file. This way you can make a rough estimate based on the filtered SNPs.
My goal was to read out all SNPs of all blocks of I-S2599, as well as relevant subgroups, regardless of whether these are ‘publicly known’ or ‘only’ private variants of living testers to which I have access. (In this table, the private variants were deleted before publication and the links to the .pu files were removed) For this purpose, I created my own list for filtering and compared it with the .pu file from Yleaf. You are welcome to take my completed table from the attachment and use it as a basis. Please have a look at the fields and the formulas before you start. Not all columns and information are absolutely necessary.
Create main file (aDNA-SNPs.xlsx):
- Open an empty Excel file (or use my file as a basis).
- Insert columns to sort the blocks. (‘Haplogroup sort’ to sort the blocks, ‘Time sort’ to sort the SNPs within the blocks, if desired)
- Extract the SNP data from the FTDNA tree (Discover) block by block. Discover – Scientific Details – Variants. (Copy all lines into the table, in my case there were over 800 lines in total). Unfortunately, this list only contains the position for hg38.
- Add column for position hg19.
- Use Lift Genome Annotations to determine the position for hg19 for each h38 position and enter it in the hg19 column.
- If required, repeat the previous point to obtain the T2T position.
- The columns Ychr Region, FTDNA level and YFull level are for information only and are not essential.
Create file for filtering (SNPs.xlsx):
- Copy as the finished main file.
- Delete all lines that do not contain a value for position hg19.
- Keep only the following columns (delete others) and put them in this order: Position (hg19) – Haplogroup sort – Name – Position (GRCh38) – Anc. – Der. – Synonyms.
Continue in the main file:
- Add file for filtering in main file via ‘Load to’ (Excel): Data – From text csv – Select and import file – Load to – Create connection only.
- Add .pu files to main file via ‘Load to’ (Excel): Data – From text csv – Select and import .pu file – Load to – Create connection only.
- Combine queries: Data – Combine queries – Merge.
- First select column Position hg19 in table SNPs.xlsx, then select column Position hg19 in .pu file, confirm with ok.
- In the Powerquery Editor, activate columns 4 and 5 of the .pu file and add them to the rows of the SNPs.xlsx table.
- Name the combined query with aDNA name.
- Finish with ‘Load to’
- Copy to new table. Name this tab after aDNA name.
- In my table, copy the formula in the first row of any aDNA tab from the ‘state’ column and paste it into the first row in column J. Set the column heading. Column J is now filled.
- In the aDNA tab, enter the same name as the name of the tab in line 3 in the desired column. This will automatically fill the column.
Attachement:
Studies with aDNA of Y-Haplogroup I-S2599
| reference | title | citation link | data avaibility | I-S2599 Samples |
|---|---|---|---|---|
| Schilz 2006 | Molekulargenetische Verwandtschaftsanalysen am prähistorischen Skelettkollektiv der Lichtenstenhöhle. | http://dx.doi.org/10.53846/goediss-638 | only STR Markers | |
| Mathieson et al. 2015 | Mathieson, I., Lazaridis, I., Rohland, N. et al. Genome-wide patterns of selection in 230 ancient Eurasians. Nature 528, 499–503 (2015). | https://doi.org/10.1038/nature16152 | PRJEB11450 | I0114 (390k) |
| Haak, Lazaridis et al. 2015 | Haak, W., Lazaridis, I., Patterson, N. et al. Massive migration from the steppe was a source for Indo-European languages in Europe. Nature 522, 207–211 (2015). | https://doi.org/10.1038/nature14317 | PRJEB8448 | I0114 (New 840k data added to published 390k data) |
| Seidenberg 2016 | Morphologisch-paläogenetische Bearbeitung des Skelettkollektivs aus der Lichtensteinhöhle. | http://dx.doi.org/10.53846/goediss-6152 | only STR Markers | |
| Lipson et al. 2017 | Lipson, M., Szécsényi-Nagy, A., Mallick, S. et al. Parallel palaeogenomic transects reveal complex genetic history of early European farmers. Nature 551, 368–372 (2017). | https://doi.org/10.1038/nature24476 | PRJEB22629 | I4971 |
| Mathieson et al. 2018 | Mathieson, I., Alpaslan-Roodenberg, S., Posth, C. et al. The genomic history of southeastern Europe. Nature 555, 197–203 (2018). | https://doi.org/10.1038/nature25778 | PRJEB22652 | I4607, I4915, I5401 |
| Olalde et al. 2018 | Olalde, I., Brace, S., Allentoft, M. et al. The Beaker phenomenon and the genomic transformation of northwest Europe. Nature 555, 190–196 (2018). | https://doi.org/10.1038/nature25738 | PRJEB23635 | I2977, I3137 |
| Blöcher 2019 | Genetic variation related to the adaptation of humans to an agriculturalist lifestyle | http://doi.org/10.25358/openscience-3112 | GR1 | |
| Brace et al. 2019 | Brace, S., Diekmann, Y., Booth, T.J. et al. Ancient genomes indicate population replacement in Early Neolithic Britain. Nat Ecol Evol 3, 765–771 (2019). | https://doi.org/10.1038/s41559-019-0871-9 | PRJEB31249 | I6767 (Cheddar man) |
| Antonio et al. 2019 | Ancient Rome: a genetic crossroads of Europe and the Mediterranean. | https://doi.org/10.1126/science.aay6826 | PRJEB32566 | R11 |
| Marcus et al. 2020 | Marcus, J.H., Posth, C., Ringbauer, H. et al. Genetic history from the Middle Neolithic to present on the Mediterranean island of Sardinia. Nat Commun 11, 939 (2020). | https://doi.org/10.1038/s41467-020-14523-6 | PRJEB35094 | I18945 (SUC009) |
| Cassidy et al. 2020 | Cassidy, L.M., Maoldúin, R.Ó., Kador, T. et al. A dynastic elite in monumental Neolithic society. Nature 582, 384–388 (2020). | https://doi.org/10.1038/s41586-020-2378-6 | PRJEB36854 | SRA62 |
| Brunel, S. et al. 2020 | Ancient genomes from present-day France unveil 7,000 years of its demographic history. | https://doi.org/10.1073/pnas.1918034117 | PRJEB38152 | PER3123 |
| Immel et al. 2021 | Analysis of genomic DNA from medieval plague victims suggests long-term effect of Yersinia pestis on human immunity genes. | https://doi.org/10.1093/molbev/msab147 | PRJEB44124 | ELW030 |
| Patterson et al. 2021 | Patterson, N., Isakov, M., Booth, T. et al. Large-scale migration into Britain during the Middle to Late Bronze Age. Nature 601, 588–594 (2022). | https://doi.org/10.1038/s41586-021-04287-4 | PRJEB47891 | I17327, I19859, I7959, I3137 (new) |
| Frischalowski 2022 | Genetische Diversität in der Lichtensteinhöhle – Ableitungen zur Demographie und Interpretationen zu sozialen Strukturen sowie Bestattungssitten in einer bronzezeitlichen Bevölkerung. | http://dx.doi.org/10.53846/goediss-9081 | only STR Markers | |
| Dulias et al. 2022 | Ancient DNA at the edge of the world: Continental immigration and the persistence of Neolithic male lineages in Bronze Age Orkney. | https://doi.org/10.1073/pnas.2108001119 | PRJEB46830 | KD026 |
| Hofmanová et al. 2022 | Between fishing and farming: palaeogenomic analyses reveal cross-cultural interactions triggered by the arrival of the Neolithic in the Danube Gorges | https://doi.org/10.1101/2022.06.24.497512 | PRJEB47916 | GR1 |
| Fischer et al. 2022 | Origin and mobility of Iron Age Gaulish groups in present-day France revealed through archaeogenomics. | https://doi.org/10.1016/j.isci.2022.104094 | PRJEB50940 | GLN32 |
| Lazaridis et al. 2022 | The genetic history of the Southern Arc: A bridge between West Asia and Europe. | https://doi.org/10.1126/science.abm4247 | PRJEB54831 | I7126 |
| Gretzinger et al. 2022 | Gretzinger, J., Sayer, D., Justeau, P. et al. The Anglo-Saxon migration and the formation of the early English gene pool. Nature 610, 112–119 (2022). | https://doi.org/10.1038/s41586-022-05247-2 | PRJEB54899 | BUK024, I11590, I20641, I20675 |
| Stolarek et al. 2023 | Stolarek, I., Zenczak, M., Handschuh, L. et al. Genetic history of East-Central Europe in the first millennium CE. Genome Biol 24, 173 (2023). | https://doi.org/10.1186/s13059-023-03013-9 | PRJEB48333 | PCA0385 |
| Posth et al. 2023 | Posth, C., Yu, H., Ghalichi, A. et al. Palaeogenomics of Upper Palaeolithic to Neolithic European hunter-gatherers. Nature 615, 117–126 (2023). | https://doi.org/10.1038/s41586-023-05726-0 | PRJEB51862 | GFW001, VO1001, VO1003 |
| Chyleński et al. 2023 | Chyleński, M., Makarowicz, P., Juras, A. et al. Patrilocality and hunter-gatherer-related ancestry of populations in East-Central Europe during the Middle Bronze Age. Nat Commun 14, 4395 (2023). | https://doi.org/10.1038/s41467-023-40072-9 | PRJEB53670 | poz498, poz720 |
| Mattila et al. 2023 | Mattila, T.M., Svensson, E.M., Juras, A. et al. Genetic continuity, isolation, and gene flow in Stone Age Central and Eastern Europe. Commun Biol 6, 793 (2023). | https://doi.org/10.1038/s42003-023-05131-3 | PRJEB59598 | ukr33, ukr159, ukr160, ukr161 |
| Hui at al. 2023 | Medieval social landscape through the genetic history of Cambridgeshire before and after the Black Death. | https://doi.org/10.1101/2023.03.03.531048 | PRJEB59976 | 522 |
| Gînguță et al. 2023 | Genetic identification of members of the prominent Báthory aristocratic family. | https://doi.org/10.1016/j.isci.2023.107911 | PRJEB63184 | PER11 |
| Gelabert et al. 2024 | Social and genetic diversity among the first farmers of Central Europe. | https://doi.org/10.1101/2023.07.07.548126 | PRJEB64177 | I10351 |
| Allentoft et al. 2024 | Allentoft, M.E., Sikora, M., Refoyo-Martínez, A. et al. Population genomics of post-glacial western Eurasia. Nature 625, 301–311 (2024). | https://doi.org/10.1038/s41586-023-06865-0 | PRJEB64656 | NEO254, NEO270, NEO502, NEO514, NEO528, NEO552, NEO747 |
| Allentoft et al. 2024b | Allentoft, M.E., Sikora, M., Fischer, A. et al. 100 ancient genomes show repeated population turnovers in Neolithic Denmark. Nature 625, 329–337 (2024). | https://doi.org/10.1038/s41586-023-06862-3 | PRJEB64656 | NEO254, NEO747 |
| Gretzinger et al. 2024 | Gretzinger, J., Schmitt, F., Mötsch, A. et al. Evidence for dynastic succession among early Celtic elites in Central Europe. Nat Hum Behav (2024). https://doi.org/10.1038/s41562-024-01888-7 | https://doi.org/10.1038/s41562-024-01888-7 | PRJEB73566 | MBG008 |
| Ravasins et al. 2024 | Ravasini, F., Kabral, H., Solnik, A. et al. The genomic portrait of the Picene culture provides new insights into the Italic Iron Age and the legacy of the Roman Empire in Central Italy. Genome Biol 25, 292 (2024). | https://doi.org/10.1186/s13059-024-03430-4 | PRJEB77116 | EV18, EV16A |
| Niktin et al. 2024 | A genomic history of the North Pontic Region from the Neolithic to the Bronze Age | https://doi.org/10.1101/2024.04.17.589600 | PRJEB81468 | I27994 |
| George et al. 2025 | forthcoming study | cze001 |
Links of files to download
I-S2599 – aDNA – SNPs – A true ‘wall of SNiPs’, master SNP table, SNP block overview and SNP tables of all aDNA samples.
I-S2599 – aDNA – Samples – All studies and aDNA samples from I-L38 to I-S2599.